Each beam contains a sinusoidal oscillation, and points in the entire sinusoidal oscillation array having the same phase direction form a refractive surface that is perpendicular to the plane wavefront of the propagation direction. In the ideal case, the incident wavefront juxtaposed to each other are deformed to form a spherical wave that accurately satisfies the focal length F. But this ideal situation will not occur because the true wavefront display is different from the perfect refractive spherical wave. This deviation or aberration is called Wavefront Aberration.
When the wavefront aberration is smaller, the quality of the refractive system is higher.
The refractive system of the human eye also has wavefront aberrations, so the visual quality of the human eye is evaluated by wavefront aberration.
Human Eye Wavefront Aberration source:
• The surface of the cornea and lens is not ideal, and the surface curvature has local deviation;
• Different axes of the cornea, lens and vitreous;
• The inclusions of the cornea, lens and vitreous are not uniform, so that the refractive index has local deviation;
• The refractive index of the human eye refractive system to various colors of light is different, so chromatic aberration inevitably occurs.
Wavefront Aberration Description: Zernike Polynomials
Zernike polynomials are commonly used to describe wavefront aberration.
The Dutch physicist and Nobel laureate Frits Zenike (1888-1966, the inventor of the aberration microscope) successfully gave a mathematical representation of the true wavefront and ideal deviation by polynomial fitting. Each polynomial is named according to the image defect represented (eg. coma, spherical aberration). Zernike polynomials are also known as ring polynomials because they refer to circles with a radius of 1, expressed in polar coordinates. From a mathematical point of view, each Zernike polynomial is represented by a product of multiple powers of radius r and multiple powers of angle variable θ.
A Zernike polynomial has the following definition:
Z0, 0 height constant, average surface height
Z1, ±1 tilt (x direction +1, y direction -1)
Z2, 0 conical part shape focal length or surface
Z2, ±2 astigmatism
Z3, ±1 coma
Z3, ±3 trilobal
Z4, 0 spherical aberration
Z4, ±2 high order (4) astigmatism
Z4, ±4 four-leaf defect
Z5, ±1 high order (5) coma
Z5, ±3 high order (5) trilobal
Z5, ±5 five-leaf defect
Z6, 0 high order (6) spherical aberration
Z6, ±2 high order (6) astigmatism
Z6, ±4 high-order (6) four-leaf defect
Z6, ±6 six-leaf defect
Aberration Analysis Function
Click on the left section to start the Scansys TA517 “Aberration” analysis function.
As follows:
This view is based on the measured corneal anterior and posterior surface height data and calculates the true wave front according to the principle of Ray Tracing. It is assumed that the refractive index in the air = 1.0, the refractive index of the cornea = 1.176, and the refractive index of the aqueous humor = 1.336. Then, the difference between the front of the real wave and the front of the ideal wave is used for avefront aberration analysis. It calculates a coefficient for each Zernike polynomial term, which describes the contribution of this polynomial to the wavefront aberration data.
The 2D topographic map on the right upper represents the height data of the fit and can be left clicked to see the height at any location of the cornea. The software automatically finds the highest point, indicated by a white cross on the way. The position of this point is displayed by the option box (x-Pos; and y-Pos) in the upper right corner. Right click on the fitted height map to pop up the topographic Map Display Settings.
Introduction of Setting
1. By selecting the top drop-down box, select the anterior, posterior, full corneal switching of the corneal anterior and posterior corneal aberration analysis.
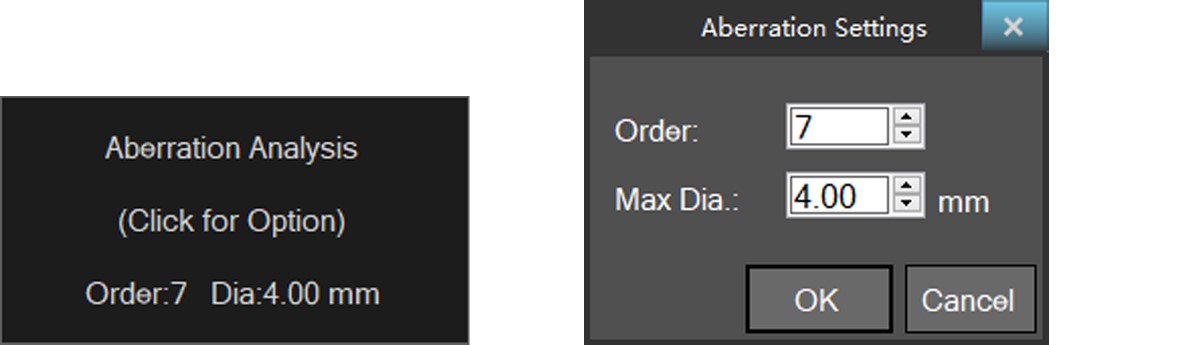
2. Click on the upper partof the settings box to set the Order of the Zernike fit and the corneal Maximumdata Diameter.
3. The four options in the upper left corner are low-order aberration, high-order aberration, full phase difference, and all the switch buttons are turned off. Of course, the user can manually click on a switch to determine whether the item participates in the data fit.
4. Mean and RMS means the average value and root mean square value of selected items.